
AQA Syllabus focus:
'Normal and skewed distributions; analysis and interpretation of correlation, including correlation coefficients.'
Understanding how data are distributed and how relationships between variables are described helps psychologists choose sensible interpretations and avoid misleading claims about patterns found in research findings.
Understanding distributions
In research methods, a distribution is the pattern of scores across a data set. Looking at the shape of a distribution helps psychologists judge whether scores are clustered around the center, spread evenly, or pulled toward one end of the scale.
A normal distribution is the pattern psychologists often expect when many scores gather around an average value and fewer scores appear at the extremes.
Normal distribution: a symmetrical distribution in which most scores are near the center and the number of scores decreases evenly toward both extremes.
This shape is often described as bell-shaped because it rises to a central peak and falls away evenly on both sides. On a graph, the highest point is at the center because that is where the greatest number of scores are found.
Features of a normal distribution
The distribution is symmetrical.
The mean, median, and mode are the same, or very close together.
Most scores are found around the middle of the distribution.
Very high and very low scores are relatively uncommon.
The pattern suggests that the data are balanced rather than pulled strongly in one direction.
When data are normally distributed, the average usually represents the group reasonably well. This makes interpretation simpler because the center of the data reflects the typical score more accurately.
Skewed distributions
Not all psychological data are symmetrical.
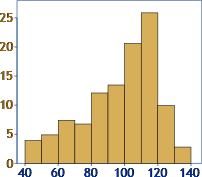
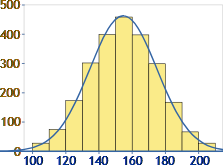
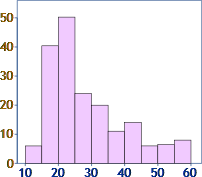
This set of three small graphs contrasts a negatively skewed distribution, a symmetric (no-skew) distribution, and a positively skewed distribution. Seeing the three shapes side-by-side makes it easier to remember that skew is named for the direction of the tail, not where most scores are concentrated. Source
Some sets of scores are skewed, meaning that one side of the distribution stretches out farther than the other.
Skewed distribution: a distribution that is not symmetrical because scores are clustered more at one end, producing a longer tail on one side.
A skewed pattern usually means that a small number of unusually high or unusually low scores are affecting the overall shape of the data.
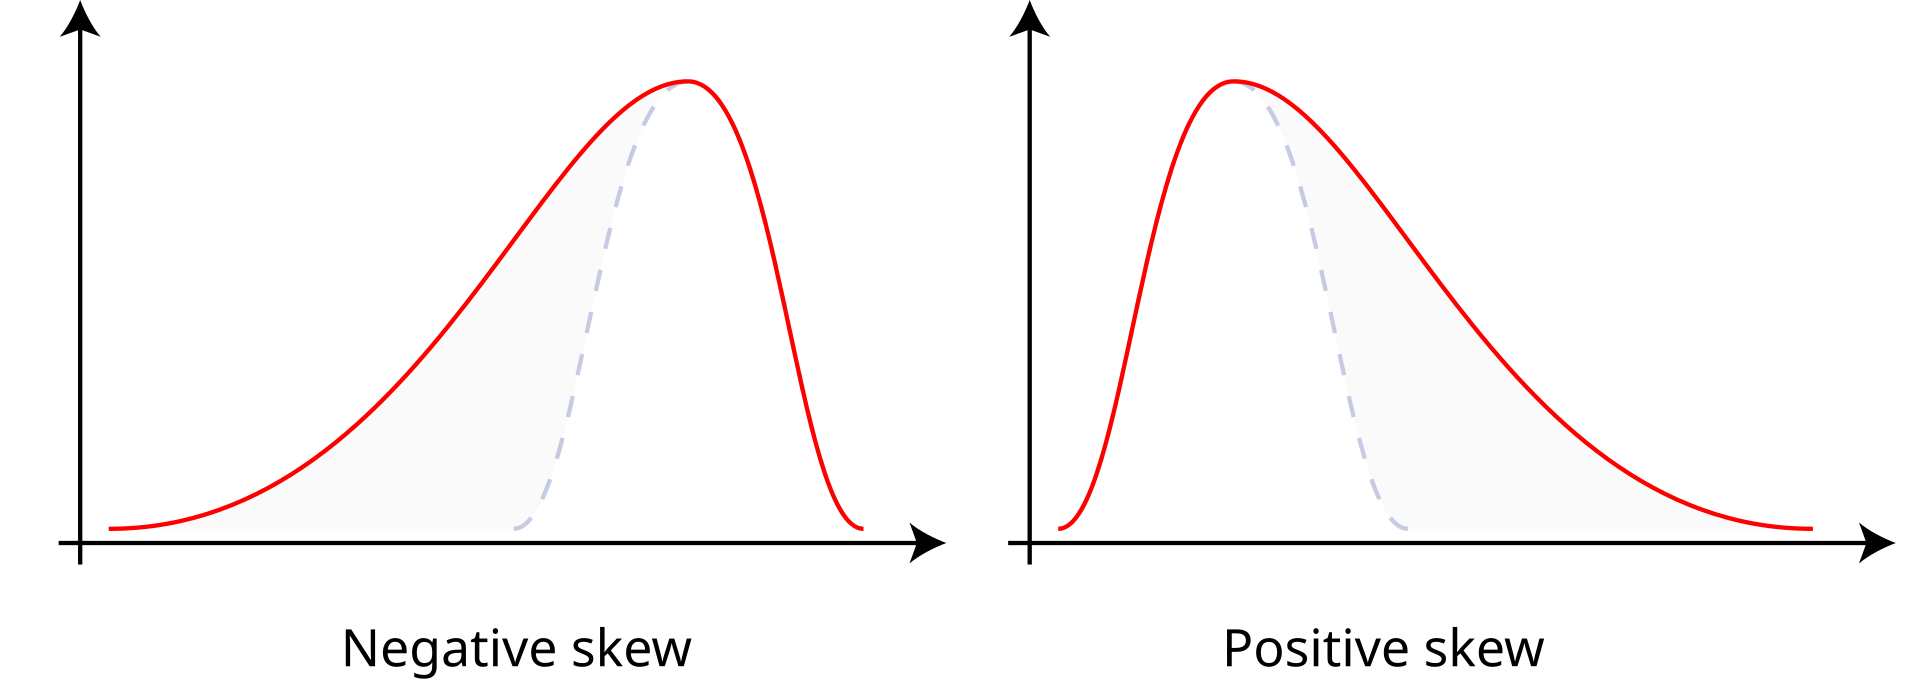
This diagram compares negative and positive skew by showing where the long tail appears in each distribution. It helps you quickly identify whether most scores are piled up at the high end (negative skew) or the low end (positive skew), with only a few extreme values stretching the tail. Source
A positive skew has a long tail to the right. Most scores are lower, but a few unusually high scores extend the distribution upward.
A negative skew has a long tail to the left. Most scores are higher, but a few unusually low scores extend the distribution downward.
Recognizing skew is important because it affects how psychologists describe the data. In a strongly skewed distribution, the mean can be pulled away from the score that seems most typical. This means the center of the distribution may look different depending on which descriptive measure is considered.
A normal distribution and a skewed distribution therefore tell different stories. A normal shape suggests balance around the center, whereas a skewed shape suggests that scores are unevenly spread and that one end of the scale contains more extreme values.
Analyzing correlation
A correlation examines whether two measured variables are related. It looks at whether scores on one variable are associated with scores on another.
Direction of a correlation
There are three main ways to interpret the direction of a relationship:
A positive correlation means that as one variable increases, the other also increases.
A negative correlation means that as one variable increases, the other decreases.
A zero correlation means there is no clear relationship between the variables.
The direction tells psychologists whether the variables move in the same direction or in opposite directions. This is an essential part of interpreting any relationship found in the data.
Correlation coefficients
Psychologists often summarize the relationship using a correlation coefficient.
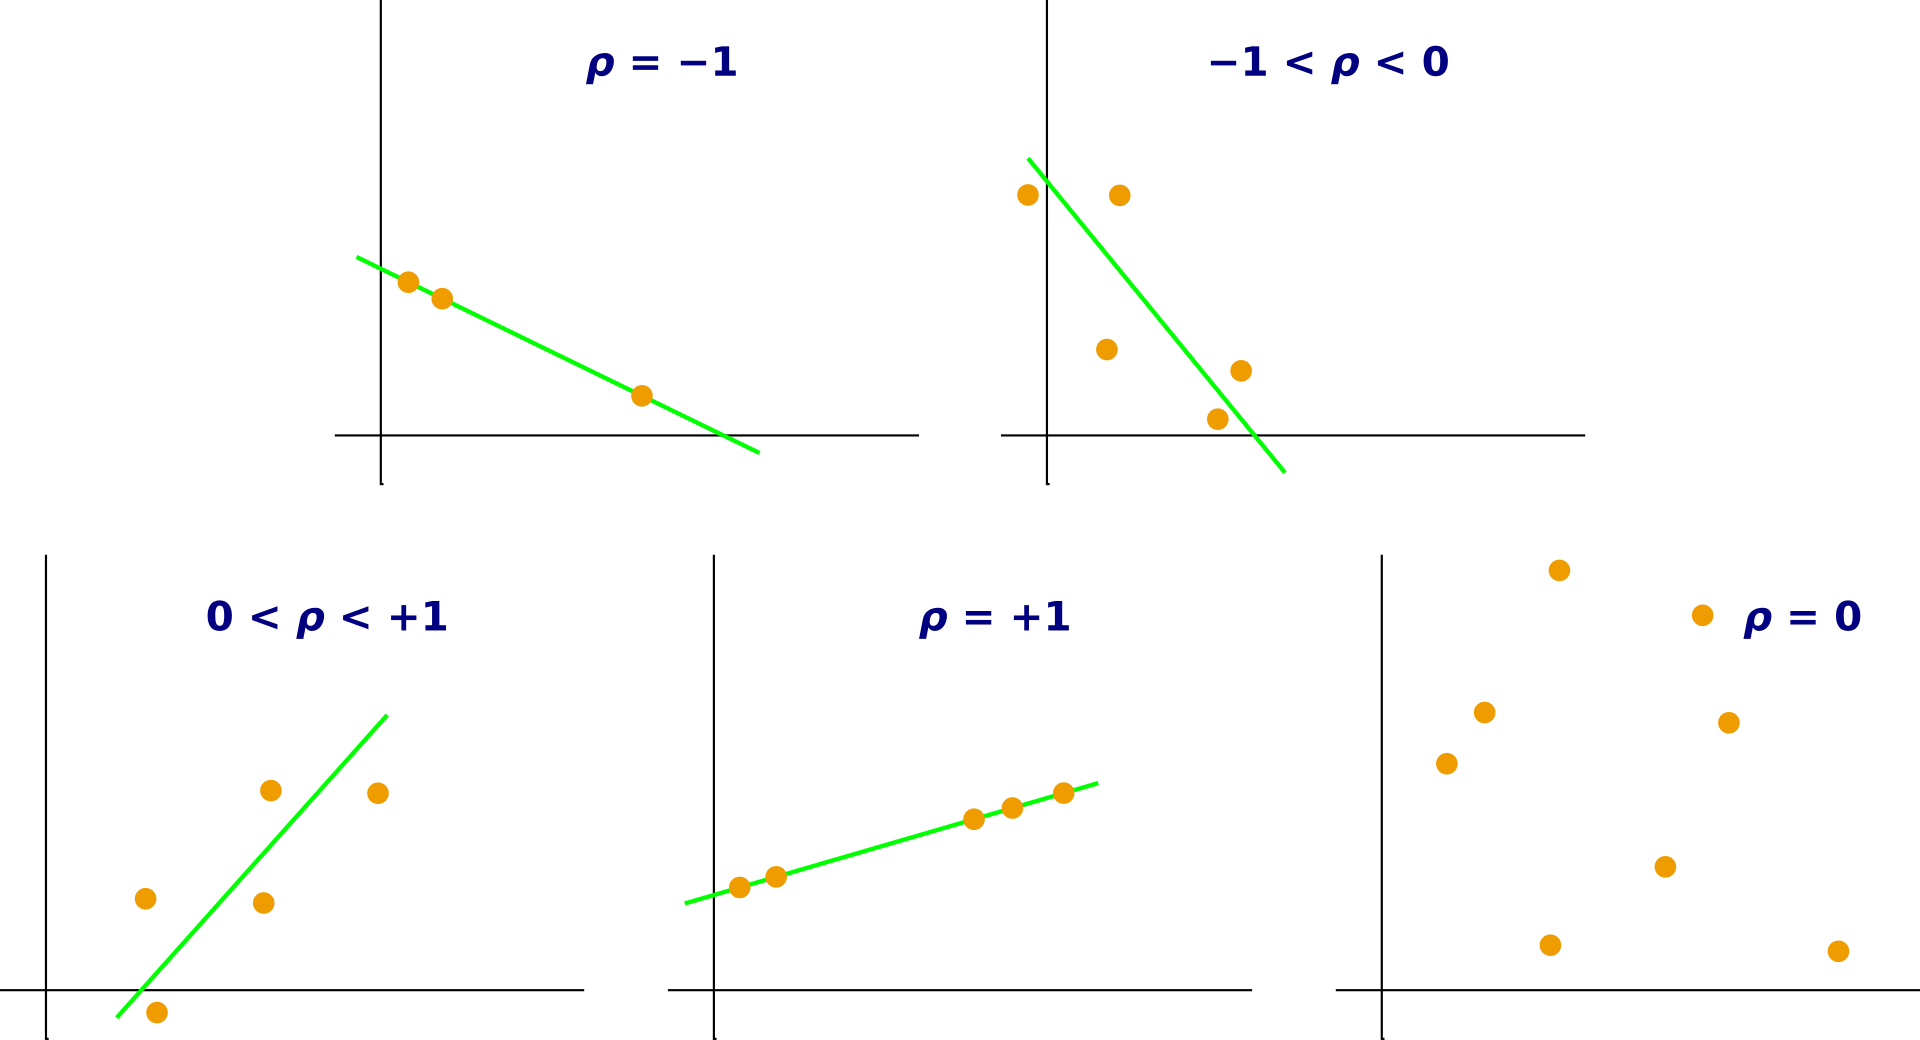
This figure shows how the appearance of a scatterplot changes as the Pearson correlation coefficient (ρ) moves from strongly negative to strongly positive values. It makes the key idea visually concrete: the sign indicates direction, while how tightly points cluster around a line reflects strength. Source

a numerical value that shows the direction and strength of a correlation between two variables.
The coefficient gives a more precise description than words such as "weak" or "strong" alone. This numerical summary is especially useful when psychologists want to compare different relationships across data sets.
A value close to +1 shows a strong positive correlation.
A value close to -1 shows a strong negative correlation.
A value close to 0 shows little or no correlation.
The sign of the coefficient shows the direction.
The size of the coefficient shows the strength.
For example, a coefficient of +0.80 indicates a strong positive relationship, while -0.80 indicates a strong negative relationship. These relationships are equally strong, but they run in opposite directions. A coefficient near 0 suggests that the scores do not form a clear pattern of association.
Interpreting coefficients accurately
A common mistake is to confuse direction with strength. The minus sign in a negative correlation does not mean the relationship is weaker. It only means that the variables move in opposite directions. Strength is shown by how close the coefficient is to 1 or -1.
Psychologists also need to interpret a coefficient in context. A coefficient gives a compact summary of the pattern in the data, but its meaning depends on accurate reading:
Coefficients closer to either extreme show a tighter relationship.
Coefficients near the middle of the scale show a weaker relationship.
A coefficient of +0.70 is stronger than +0.20.
A coefficient of -0.90 is stronger than -0.40.
Distributions and correlations together
These two ideas describe different aspects of data. A distribution shows the shape of scores for a variable, while a correlation coefficient shows how strongly two variables are related. A student must be able to separate these ideas clearly when interpreting results.
If a psychologist reports a normal distribution, they are describing the pattern of scores within data. If they report a positive or negative coefficient, they are describing the relationship between two variables. Accurate interpretation depends on identifying which type of information is being presented and reading the evidence correctly.
Practice Questions
Explain what is meant by a positive skewed distribution. (2 marks)
1 mark for stating that the distribution is asymmetrical or not symmetrical.
1 mark for stating that the tail extends to the right, or that most scores are lower with a few very high scores.
Describe the difference between a normal distribution and a skewed distribution, and explain how the sign and size of a correlation coefficient are interpreted. (6 marks)
1 mark for stating that a normal distribution is symmetrical.
1 mark for stating that most scores cluster around the center, or that it is bell-shaped, or that mean, median, and mode are the same or very similar.
1 mark for stating that a skewed distribution is asymmetrical or has a longer tail on one side.
1 mark for accurately describing either positive skew or negative skew.
1 mark for stating that the sign of the coefficient shows the direction of the relationship.
1 mark for stating that the size of the coefficient shows the strength, with values nearer to +1 or -1 being stronger and values near 0 being weak or absent.
FAQ
When a test is too easy, many participants score near the top, which can create a negative skew. When a test is too difficult, many participants score near the bottom, which can create a positive skew.
This happens because the test does not spread people out evenly across the scale, so the scores cluster at one end.
A curvilinear relationship changes direction instead of following a straight-line pattern. For example, one variable may increase with another only up to a certain point, then begin to decrease.
A standard correlation coefficient mainly summarizes linear relationships, so a strong curved pattern can sometimes produce a surprisingly low coefficient.
Yes. A correlation coefficient reduces a whole pattern to a single number, so different visual patterns can sometimes produce similar values.
For example, one scattergram may have evenly spread points, while another may contain clusters or unusual scores. The overall coefficient can still be similar even though the displays look different.
A small correlation can still be important if:
the behavior being studied is influenced by many factors
the pattern appears consistently across studies
the finding has practical value, such as helping predict risk or outcomes
In psychology, very large correlations are often uncommon, so smaller ones may still be meaningful.
Sample size affects how stable the coefficient is. In a very small sample, one or two unusual scores can change the value a lot.
Larger samples usually provide a more dependable estimate of the true relationship because random variation has less impact on the overall result.

.svg)