
AQA Syllabus focus:
'Descriptive statistics: mean, median, mode, range, standard deviation, percentages and positive, negative and zero correlations.'
Descriptive statistics help psychologists turn raw scores into clear summaries. They show what is typical in a data set, how much scores vary, and whether two sets of scores seem related.
Understanding descriptive statistics
Psychological investigations often produce many raw scores. Looking at individual numbers can make patterns hard to see, so researchers use descriptive statistics to organize and summarize data. These statistics describe the main features of results in a compact form, making findings easier to communicate and compare.
One important role of descriptive statistics is showing the center of a data set. Another is showing the spread of scores around that center. In this topic, you also need to understand how percentages summarize frequencies and how correlations describe patterns of relationship between co-variables.
Measures of central tendency
Measures of central tendency show the typical or average score in a data set. The three key measures are the mean, median, and mode.
Mean
The mean is calculated by adding all scores and dividing by the total number of scores. Because it uses every value in the data set, it can provide a detailed overall picture of performance or behavior. However, it can be pulled upward or downward by an unusually high or low score.
= mean score
= total of all scores
= number of scores
Because the mean includes every score, it is often useful when researchers want a single summary value that reflects the whole set of results.
Median
The median is the middle score when all scores are arranged in rank order. If there is an even number of scores, it lies halfway between the two middle values. The median is less affected by extreme scores than the mean, so it can give a more representative center when one or two scores are unusually high or low.
Mode
The mode is the most frequent score in a data set. It is useful for showing the most common response, category, or behavior. In psychology, this can be especially helpful when researchers want to identify the response that appears most often.
Each measure highlights something slightly different:
Mean: overall average using all scores
Median: middle point in ordered data
Mode: most common score
No single measure is automatically best. Psychologists sometimes report more than one measure because each can tell a slightly different story. If most participants score similarly but one score is very unusual, the mean may shift noticeably while the median stays more stable. Reading descriptive statistics carefully means considering what the measure emphasizes, not just quoting the number.
Measures of dispersion
Measures of dispersion show how spread out scores are. Two groups can have the same average but very different levels of variation, so psychologists also need a way to describe consistency.
Range
The range is the difference between the highest and lowest scores. It is a quick and simple measure of spread. A small range suggests that scores are close together, while a large range suggests greater variation. Its weakness is that it depends only on the two most extreme scores, so it can be distorted by anomalies.
Standard deviation
Standard deviation is a measure of dispersion showing how much scores tend to vary from the mean.
Standard deviation is usually more informative than range because it takes account of variation across the whole data set, not just the highest and lowest scores. Because it is based on the mean, it is usually reported alongside the mean rather than on its own.
A low standard deviation means scores cluster closely around the mean, suggesting consistent performance or responses. A high standard deviation means scores are more widely spread, suggesting greater individual differences within the group.
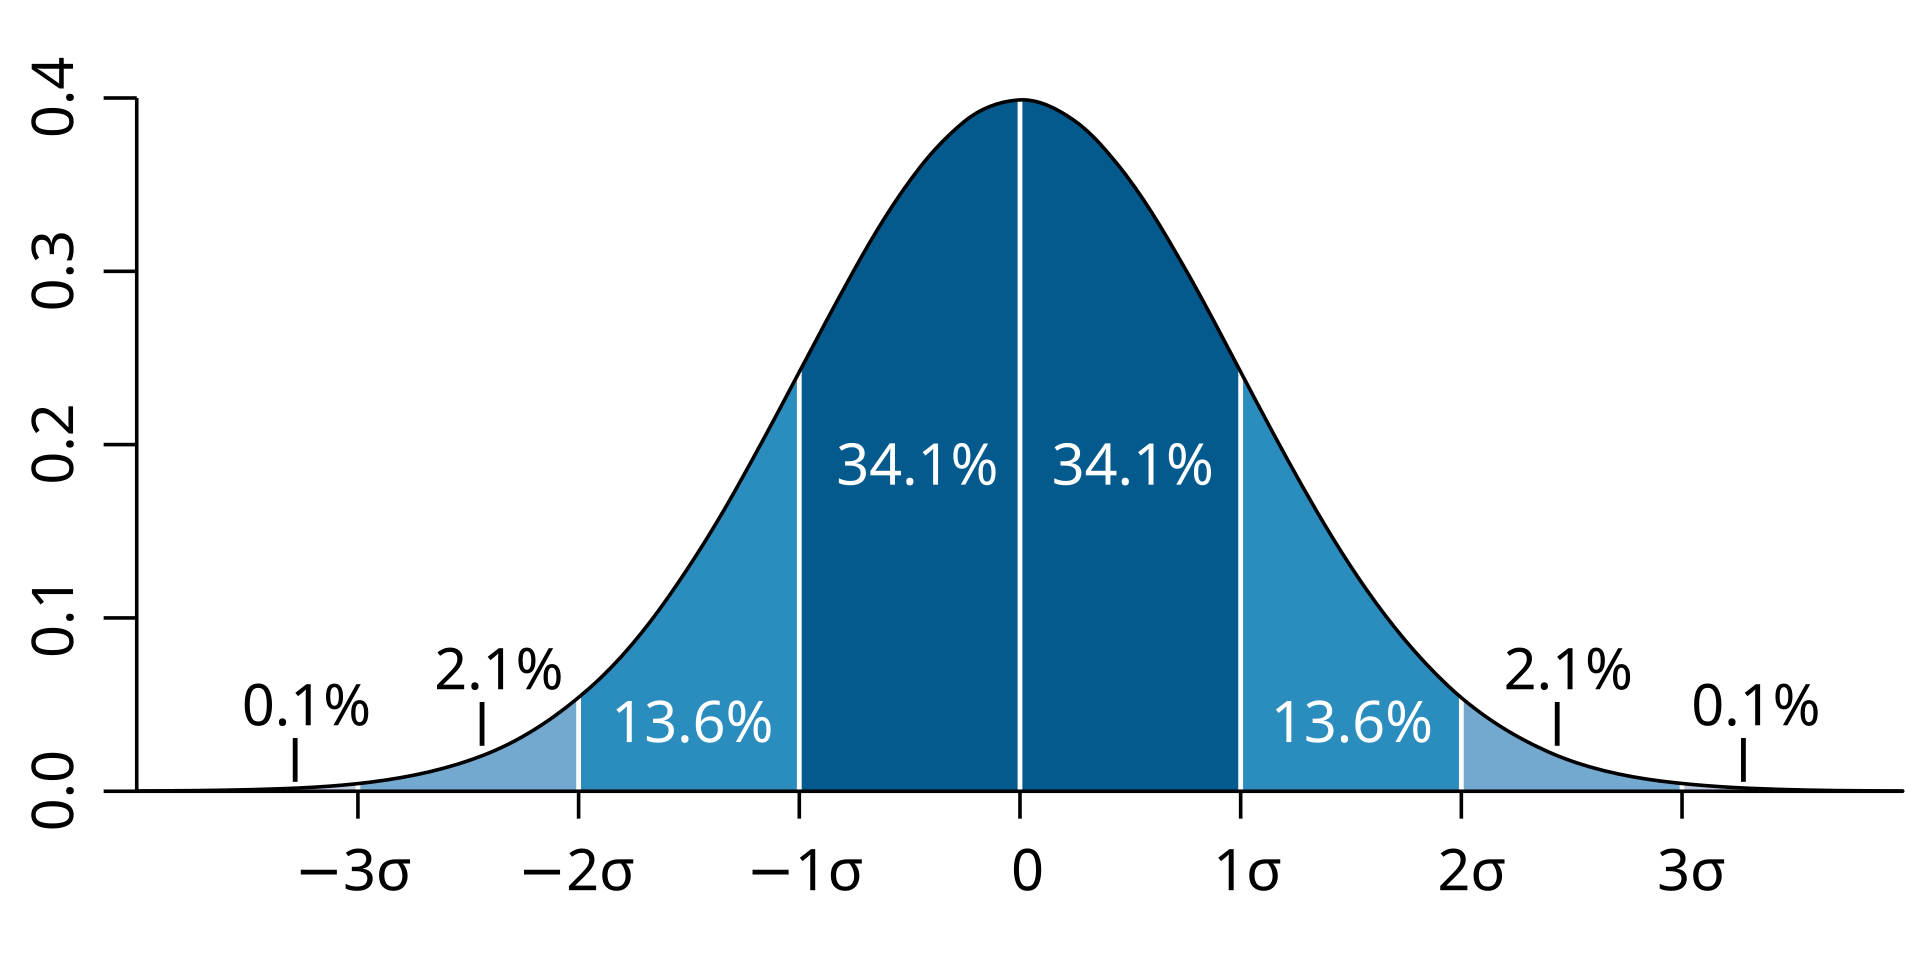
A normal distribution divided into bands of 1, 2, and 3 standard deviations from the mean, with approximate percentages labeled in each band. The diagram makes “spread around the mean” concrete by showing how observations cluster near the center and thin out toward the tails. Source
Range gives a rapid first impression of spread, but standard deviation gives a fuller picture of consistency. If scores are tightly packed around the mean, participants responded in a similar way. If scores are widely dispersed, participants differed more in their performance or behavior. This matters because two sets of results with the same mean may not represent the same level of uniformity.
Percentages
Percentages express a frequency as parts out of one hundred. They are especially useful when researchers want to compare groups of different sizes, because raw frequencies alone can be misleading. Psychologists often use percentages to describe the proportion of participants who showed a behavior, chose a response, or met a criterion.
= frequency of the category
= total number of cases
Percentages can also make findings easier to interpret for a non-specialist audience, because they turn raw counts into proportions. However, a percentage based on a very small number of participants should be interpreted cautiously, since a small change in frequency can alter the percentage a lot.
When using percentages, researchers should make clear what the total represents, because the meaning of a percentage depends on the size and nature of the sample.
Positive, negative, and zero correlations
Correlation is a descriptive measure of the direction of a relationship between two co-variables.
A positive correlation means that as one co-variable increases, the other also tends to increase.
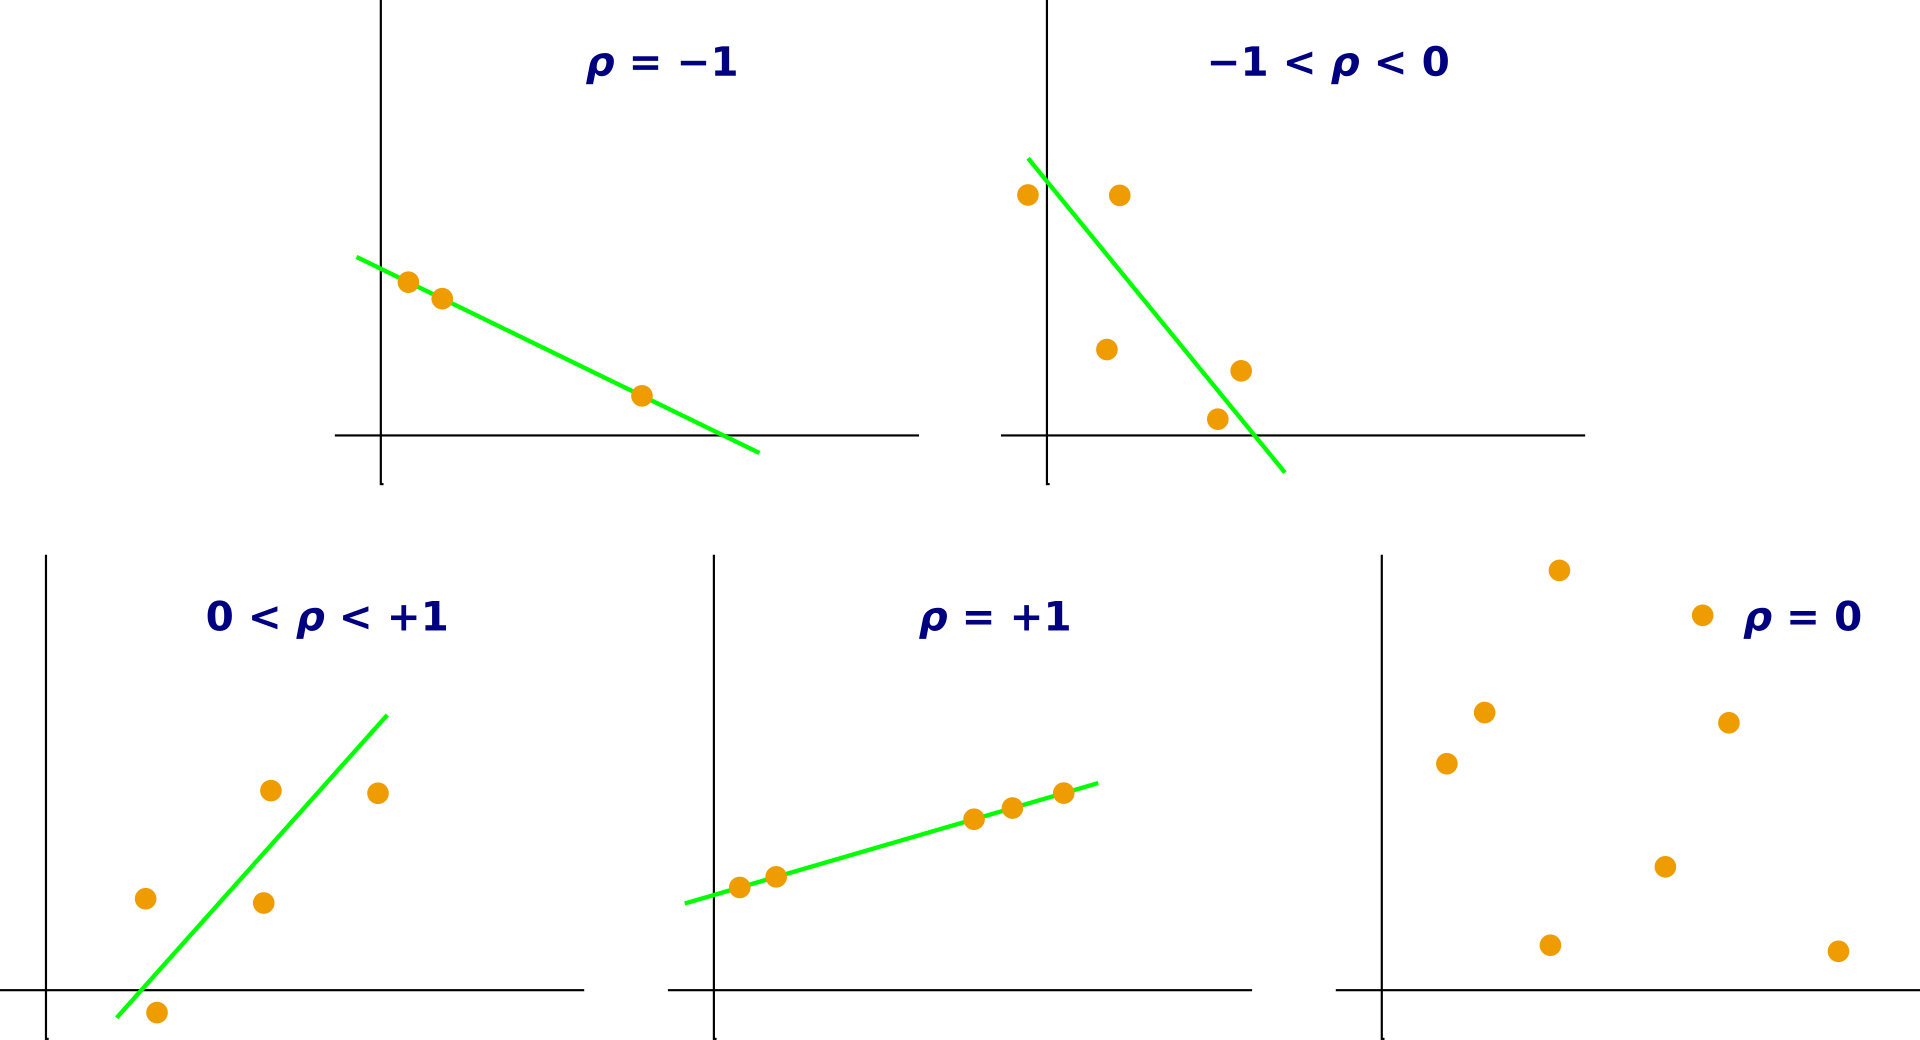
Examples of scatterplots annotated with different Pearson correlation coefficients (ρ), ranging from strong negative through zero to strong positive. This helps you identify correlation direction by whether the overall point cloud slopes downward, shows no clear trend, or slopes upward. Source
A negative correlation means that as one co-variable increases, the other tends to decrease. A zero correlation means there is no consistent relationship between the co-variables.
These descriptions refer to the overall pattern in the data rather than every single score. Real results can include exceptions, but the general trend is what matters. The clearer the trend, the easier it is to identify whether the relationship is positive, negative, or zero.
Practice Questions
Identify one measure of central tendency and one measure of dispersion used in descriptive statistics. (2 marks)
1 mark for a correct measure of central tendency: mean, median, or mode.
1 mark for a correct measure of dispersion: range or standard deviation.
Explain what psychologists mean by percentages and by positive, negative, and zero correlations. (6 marks)
1 mark for stating that a percentage is a frequency expressed out of 100.
1 mark for explaining that percentages help compare proportions across groups or categories.
1 mark for explaining a positive correlation: as one co-variable increases, the other also increases.
1 mark for explaining a negative correlation: as one co-variable increases, the other decreases.
1 mark for explaining a zero correlation: there is no consistent relationship between the co-variables.
1 additional mark for a clear descriptive point, such as correlations referring to the overall trend in the data rather than every individual score.
FAQ
Yes. A data set can be bimodal if two scores occur most often, or multimodal if several scores share the highest frequency.
This can be useful because it may suggest that the sample contains different subgroups or response patterns rather than one single common score.
Yes. A standard deviation of $0$ means every score in the data set is exactly the same.
If all participants obtained identical scores, there would be no variation around the mean, so the spread would be zero.
There are several common reasons:
Rounding individual percentages up or down
Missing data, where some participants did not answer
Multiple-response categories, where one participant can appear in more than one category
Because of rounding, totals such as $33.3%+33.3%+33.3%$ may give $99.9%$ rather than exactly $100%$.
A percentage tells you how much out of 100 belongs to a category.
A percentile tells you the position of a score relative to other scores in a distribution. For example, a score at the 80th percentile is higher than 80 percent of the scores in that group.
They sound similar, but they describe different things.
A near-zero correlation may mean there is little overall linear relationship, but it can sometimes hide more complex patterns.
For example:
Different subgroups may show different trends
A curved relationship may exist instead of a straight-line pattern
The scores may be clustered into a very narrow range
So a near-zero result does not always mean the variables are completely unrelated in every possible way.
