
AQA Syllabus focus:
'When to use Spearman’s rho, Pearson’s r, Wilcoxon, Mann-Whitney, related t-test, unrelated t-test and Chi-Squared test.'
Statistical tests must match the kind of data collected and the design of the study. In AQA Psychology, selecting the correct test depends mainly on difference or correlation, relatedness, and measurement level.
Parametric and non-parametric tests
The key decision in this part of research methods is whether a parametric or non-parametric test is appropriate. This depends on the type of data and the purpose of the analysis.
Parametric test: A statistical test used with data that meet stricter assumptions, usually including interval data and a distribution that is close to normal.
If those assumptions are not met, a psychologist usually uses a non-parametric alternative instead.
Non-parametric test: A statistical test used for nominal or ordinal data, or when interval data do not meet the assumptions needed for a parametric test.
In this AQA topic, the parametric tests are:
Pearson’s r
Related t-test
Unrelated t-test
The non-parametric tests are:
Spearman’s rho
Wilcoxon
Mann-Whitney
Chi-Squared
A correct choice always begins with three questions:
Are you testing for a correlation or a difference?
Are the data nominal, ordinal, or interval?
If it is a test of difference, are the two sets of data related or unrelated?
Using tests of correlation
A correlation test is used when a psychologist wants to find out whether there is a relationship between two co-variables. Correlation tests do not test for a difference between conditions or groups.
Use Pearson’s r when:
the study is looking for a correlation
both co-variables are measured using interval data
the data meet the assumptions for a parametric test
Pearson’s r is therefore the parametric test for correlation.
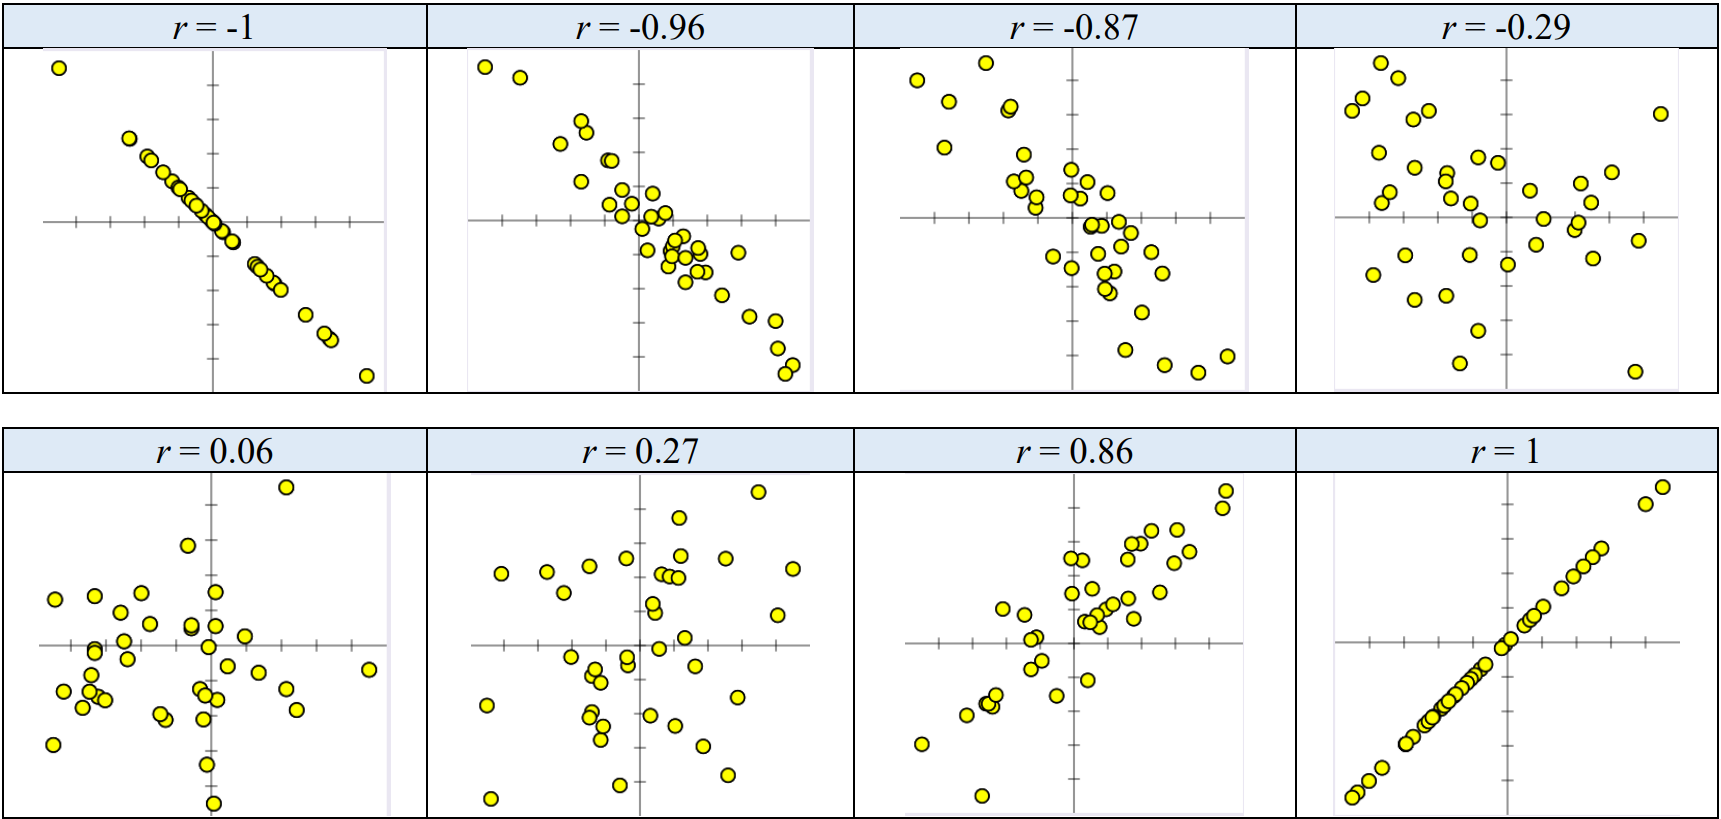
A set of example scatterplots illustrating how Pearson’s correlation coefficient, , changes with the strength and direction of a linear relationship. The sequence makes it easy to see why approaches +1 (tight upward line), 0 (no linear pattern), or −1 (tight downward line). Source
It is usually chosen when the data are measured precisely and the distribution is suitable for a parametric analysis.
Use Spearman’s rho when:
the study is looking for a correlation
the data are ordinal
the scores have been converted into ranks
the data do not meet the assumptions for a parametric test
Spearman’s rho is the non-parametric alternative to Pearson’s r.
A worked example table for Spearman’s rank correlation showing paired observations, their ranks, and the rank differences used to compute Spearman’s . It visually links the idea of “ordinal data” to the practical step of ranking scores before analysis. Source
It is especially useful when data are already in rank order, or when interval data are not suitable for a parametric test.
A common error is to choose a correlation test simply because there are two variables. The crucial point is that the researcher must be looking for an association between co-variables, not a difference between two conditions.
Using tests of difference
A test of difference is used when a psychologist wants to know whether one condition, group, or treatment produced significantly different results from another.
Use the related t-test when:
the study is testing for a difference
the design is related
the data are interval
the data are suitable for a parametric test
A related design means the two sets of scores are linked. This usually happens in:
repeated measures designs, where the same participants take part in both conditions
matched pairs designs, where each participant is paired with a similar participant in the other condition
Use the unrelated t-test when:
the study is testing for a difference
the design is unrelated
the data are interval
the data are suitable for a parametric test
An unrelated design means the scores come from different participants in each condition, so the two sets of data are independent.
Use Wilcoxon when:
the study is testing for a difference
the design is related
the data are ordinal, or are not suitable for a parametric test
Wilcoxon is the non-parametric alternative to the related t-test. It is used when the data come from repeated measures or matched pairs but do not meet the requirements for a parametric test.
Use Mann-Whitney when:
the study is testing for a difference
the design is unrelated
the data are ordinal, or are not suitable for a parametric test
Mann-Whitney is the non-parametric alternative to the unrelated t-test. It is used when the two sets of scores come from separate groups and the data are not appropriate for a parametric test.
Use Chi-Squared when:
the data are nominal
the results are in the form of frequencies
the psychologist wants to know whether the observed pattern of frequencies is significantly different from what would be expected by chance
Chi-Squared is different from the other tests in this section because it is used with categorical frequency data, not scores such as ranks or interval measurements.
A simple decision process
To choose correctly, work through the decision in order:
Step 1: Decide whether the study is testing for a correlation or a difference.
Step 2: Identify the level of measurement.
Step 3: If it is a test of difference, decide whether the design is related or unrelated.
Step 4: Match the test:
Correlation + interval + parametric = Pearson’s r
Correlation + ordinal/non-parametric = Spearman’s rho
Difference + related + interval + parametric = related t-test
Difference + unrelated + interval + parametric = unrelated t-test
Difference + related + ordinal/non-parametric = Wilcoxon
Difference + unrelated + ordinal/non-parametric = Mann-Whitney
Nominal frequency data = Chi-Squared
Common mistakes to avoid
Students often lose marks by:
choosing a t-test for ordinal or nominal data
forgetting that matched pairs count as related
using Spearman’s rho for a difference study rather than a correlation study
confusing Mann-Whitney and Wilcoxon
using Chi-Squared with scores, averages, or ranks instead of frequencies
forgetting that Pearson’s r and Spearman’s rho are both tests of correlation, not difference
Practice Questions
State two features of a study that would show that Spearman’s rho is the correct statistical test. (2 marks)
1 mark for identifying that the study is testing for a correlation/relationship between two co-variables.
1 mark for identifying that the data are ordinal, ranked, or otherwise non-parametric.
Explain how a psychologist would decide between a related t-test, an unrelated t-test, Wilcoxon, and Mann-Whitney when investigating a difference between two conditions. (6 marks)
1 mark for stating that all four are tests of difference.
1 mark for explaining that the first decision is whether the design is related or unrelated.
1 mark for explaining that a related t-test is used for a related design with interval, parametric data.
1 mark for explaining that an unrelated t-test is used for an unrelated design with interval, parametric data.
1 mark for explaining that Wilcoxon is used for a related design with ordinal or non-parametric data.
1 mark for explaining that Mann-Whitney is used for an unrelated design with ordinal or non-parametric data.
FAQ
Parametric tests are called more powerful because, when their assumptions are met, they are more sensitive to real effects in the data.
This means they are more likely to detect a genuine difference or relationship if one actually exists.
That is why psychologists usually prefer a parametric test when interval data and an appropriate distribution make it possible.
If interval data are badly skewed, a parametric test may no longer be the best choice.
In an exam, the safest response is usually to switch to the appropriate non-parametric alternative:
Pearson’s r to Spearman’s rho
related t-test to Wilcoxon
unrelated t-test to Mann-Whitney
Always match the replacement test to the aim of the study and the design.
No. Pearson’s r is most suitable when the relationship is linear, meaning it follows a roughly straight-line pattern.
If the relationship is curved, Pearson’s r may underestimate how strongly the variables are connected.
So a low Pearson’s r does not always mean there is no relationship; it may mean the relationship is not linear.
Chi-Squared is designed for frequency data, so it should be based on actual counts in categories.
Percentages on their own are not enough unless they can be converted back into frequencies.
In exam questions, if the data are presented as numbers of participants in categories, Chi-Squared may be appropriate. If the data are averages, ranks, or scores, it is not.
Yes. Tied ranks can make both tests less straightforward because these tests depend on the ordering of scores.
In many classroom and exam contexts, tied ranks are allowed, but they may require special handling in a full calculation.
For AQA-style test choice questions, tied ranks usually do not change the choice of test. The main issue is still:
correlation or difference
related or unrelated design
ordinal/non-parametric data
